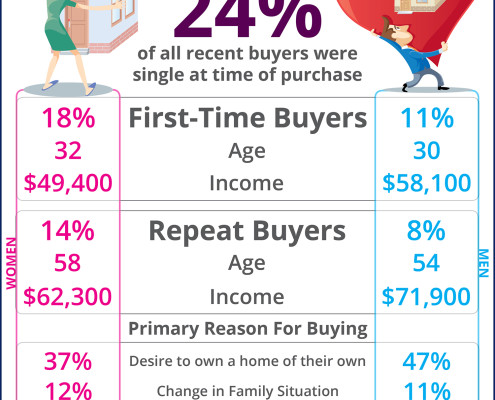
 https://www.briankludt.com/wp-content/uploads/2016/04/Single-Home-Buyers-STM.jpg 1941 1500 BrianKludtTeam https://www.briankludt.com/wp-content/uploads/2018/06/brian-kludt-mortgage-team-header-logo-ccm.png BrianKludtTeam2016-04-08 05:00:542016-04-08 05:00:54More & More Singles Are Falling For Their Dream Home [INFOGRAPHIC]
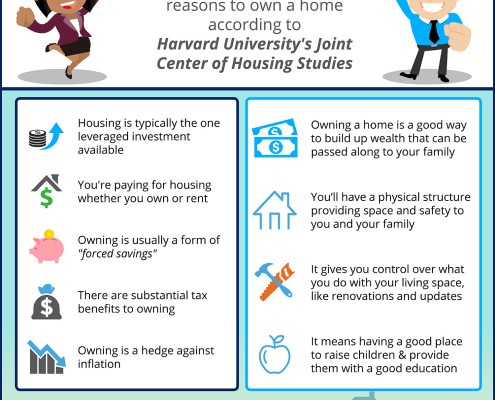 https://www.briankludt.com/wp-content/uploads/2016/04/Dont-Be-Fooled-STM.jpg 2000 1500 BrianKludtTeam https://www.briankludt.com/wp-content/uploads/2018/06/brian-kludt-mortgage-team-header-logo-ccm.png BrianKludtTeam2016-04-01 05:00:082016-04-01 05:00:08Don’t Be Fooled… Homeownership Is A Great Investment! [INFOGRAPHIC]
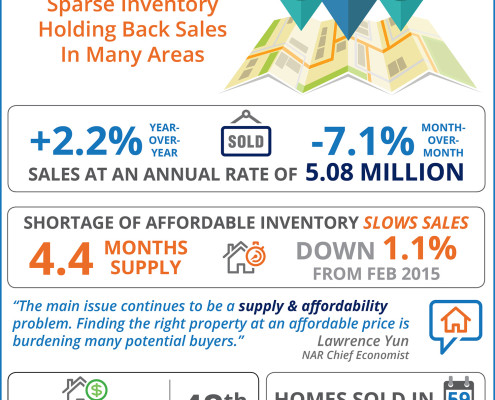 https://www.briankludt.com/wp-content/uploads/2016/03/EHS-MAR-STM.jpg 1941 1500 BrianKludtTeam https://www.briankludt.com/wp-content/uploads/2018/06/brian-kludt-mortgage-team-header-logo-ccm.png BrianKludtTeam2016-03-25 05:00:252016-03-25 05:00:25Home Sales Up Year-Over-Year
 https://www.briankludt.com/wp-content/uploads/2016/03/Mortgage-Process-STM.jpg 2000 1214 BrianKludtTeam https://www.briankludt.com/wp-content/uploads/2018/06/brian-kludt-mortgage-team-header-logo-ccm.png BrianKludtTeam2016-03-18 05:00:142016-03-18 05:00:14The Mortgage Process: What You Need To Know [INFOGRAPHIC]
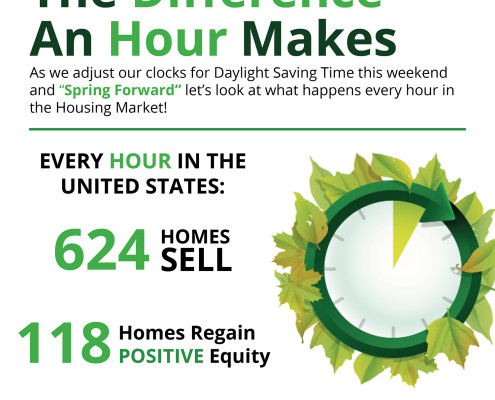 https://www.briankludt.com/wp-content/uploads/2016/03/The-Difference-a-Hour-Makes-STM.jpg 1941 1500 BrianKludtTeam https://www.briankludt.com/wp-content/uploads/2018/06/brian-kludt-mortgage-team-header-logo-ccm.png BrianKludtTeam2016-03-11 05:00:322016-03-11 05:00:32The Difference An Hour Makes This Spring [INFOGRAPHIC]
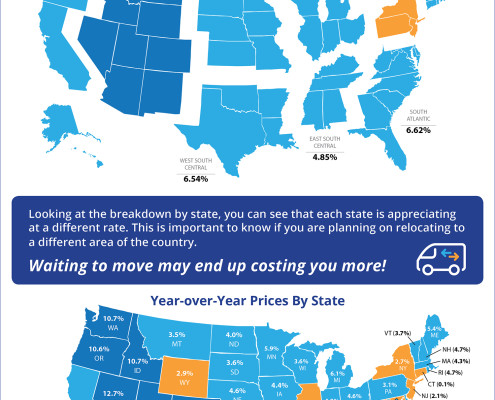 https://www.briankludt.com/wp-content/uploads/2016/03/FHFA-Home-Prices-STM.jpg 2294 1500 BrianKludtTeam https://www.briankludt.com/wp-content/uploads/2018/06/brian-kludt-mortgage-team-header-logo-ccm.png BrianKludtTeam2016-03-04 05:00:282016-03-04 05:00:28Home Prices Up 5.76% Across The Country! [INFOGRAPHIC] https://www.briankludt.com/wp-content/uploads/2016/03/FHFA-Home-Prices-STM.jpg 2294 1500 BrianKludtTeam https://www.briankludt.com/wp-content/uploads/2018/06/brian-kludt-mortgage-team-header-logo-ccm.png BrianKludtTeam2016-03-04 05:00:282016-03-04 05:00:28Home Prices Up 5.76% Across The Country! [INFOGRAPHIC]
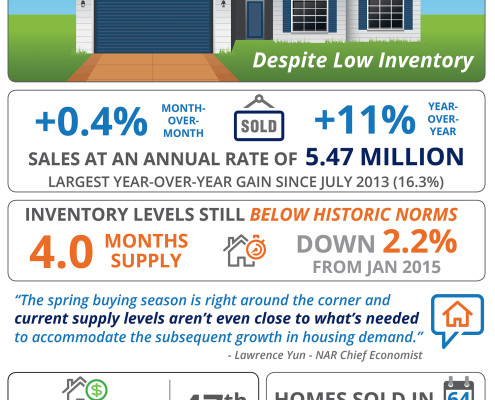 https://www.briankludt.com/wp-content/uploads/2016/02/EHS-FEB-STM.jpg 1941 1500 BrianKludtTeam https://www.briankludt.com/wp-content/uploads/2018/06/brian-kludt-mortgage-team-header-logo-ccm.png BrianKludtTeam2016-02-26 05:00:392016-02-26 05:00:39Exising Home Sales Inch Up In January [INFOGRAPHIC]
 https://www.briankludt.com/wp-content/uploads/2016/02/How-to-Create-Real-Family-Wealth-Infographic-No-Footer.png 4875 700 BrianKludtTeam https://www.briankludt.com/wp-content/uploads/2018/06/brian-kludt-mortgage-team-header-logo-ccm.png BrianKludtTeam2016-02-19 05:00:032016-02-19 05:00:03How To Create Real Family Wealth [INFOGRAPHIC]
 https://www.briankludt.com/wp-content/uploads/2016/02/Perfect-Match-STM.jpg 2088 1500 BrianKludtTeam https://www.briankludt.com/wp-content/uploads/2018/06/brian-kludt-mortgage-team-header-logo-ccm.png BrianKludtTeam2016-02-12 05:00:462016-02-12 05:00:46How Do You Know If You’ve Found Your ‘Perfect Match’? [INFOGRAPHIC]
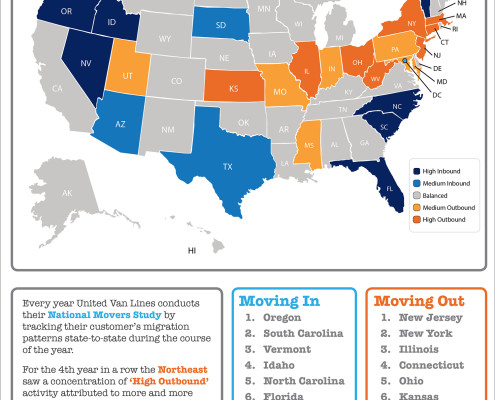 https://www.briankludt.com/wp-content/uploads/2016/02/MovingAcrossAmerica2016-STM.jpg 1941 1500 BrianKludtTeam https://www.briankludt.com/wp-content/uploads/2018/06/brian-kludt-mortgage-team-header-logo-ccm.png BrianKludtTeam2016-02-05 11:00:352016-02-05 11:00:35Where Are Americans Moving? [INFOGRAPHIC]
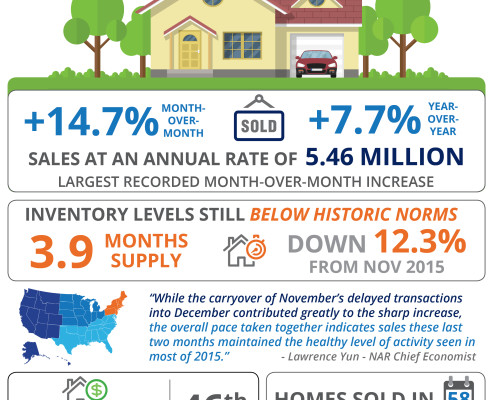 https://www.briankludt.com/wp-content/uploads/2016/02/EHS-JAN-STM.jpg 3300 2550 BrianKludtTeam https://www.briankludt.com/wp-content/uploads/2018/06/brian-kludt-mortgage-team-header-logo-ccm.png BrianKludtTeam2016-01-29 11:00:222016-02-03 18:09:45Existing Home Sales Bounce Back [INFOGRAPHIC]